We reviewed public forums and selected five recurring questions where data can add perspective. Our analysis combines AEMO prices, source-checked FoxESS reports from selected systems connected to our platform across four Australian states in May, July and September 2026, and clearly labelled models.
The focus: when stored energy is available, needed and valuable.
SoCrates is a solar and battery automation platform used by 1,000+ households. It combines controls based on prices and weather with performance analytics; full access is currently free.
1. Are the easy battery arbitrage days over?
The typical evening wholesale premium narrowed sharply, and high-price days became less frequent in every NEM region.
We compared April–September 2025 with the same months in 2026 using AEMO's five-minute regional prices.
For each date, we subtracted mean midday prices (11am–2pm) from mean evening prices (4–9pm), in fixed AEST, then took the median across dates to reduce exceptional days' influence.
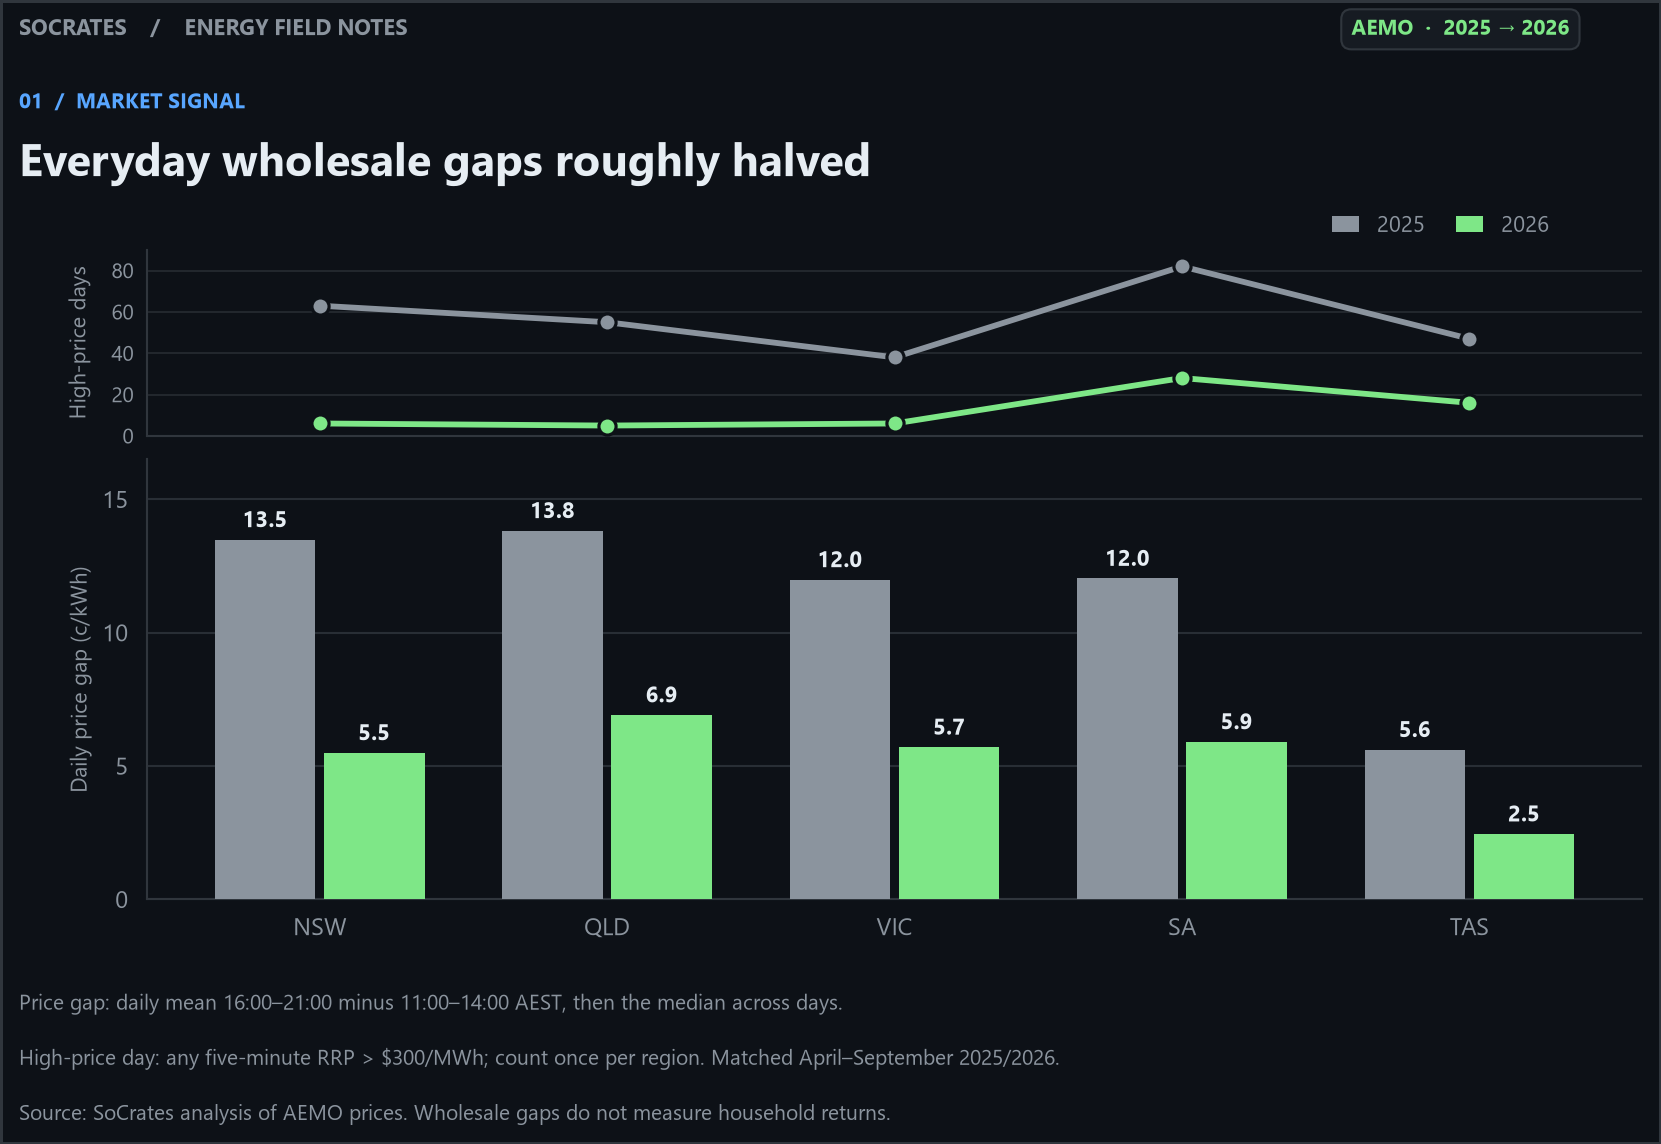
The gap fell from 13.5 to 5.5 c/kWh in NSW and from 13.8 to 6.9 in Queensland. Across all five regions, the decline was approximately 50–59%.
High-price days also fell: NSW went from 63 to 6; South Australia from 82 to 28. We count a date once per region if any five-minute price exceeds $300/MWh, at any hour, using AEMO's cap-return threshold. This counts wholesale-price events, not profitable household trades.
AEMO's Q2 2026 report describes a flatter intraday price profile alongside higher renewable supply, greater battery discharge and lower evening demand. Our comparison cannot separate their individual effects.
Revisit current opportunities and costs before projecting old trading results forward. Explore regional patterns in SoCrates' public Market Insights preview.
2. Does a bigger battery really mean buying less grid electricity?
Extra capacity helps only when there is enough charging energy and demand to use it.
The model maps 15 kWh of demand outside solar hours, charging only from surplus solar, at 90% round-trip efficiency. Capacity means usable energy delivered to loads, rather than manufacturer nameplate capacity.
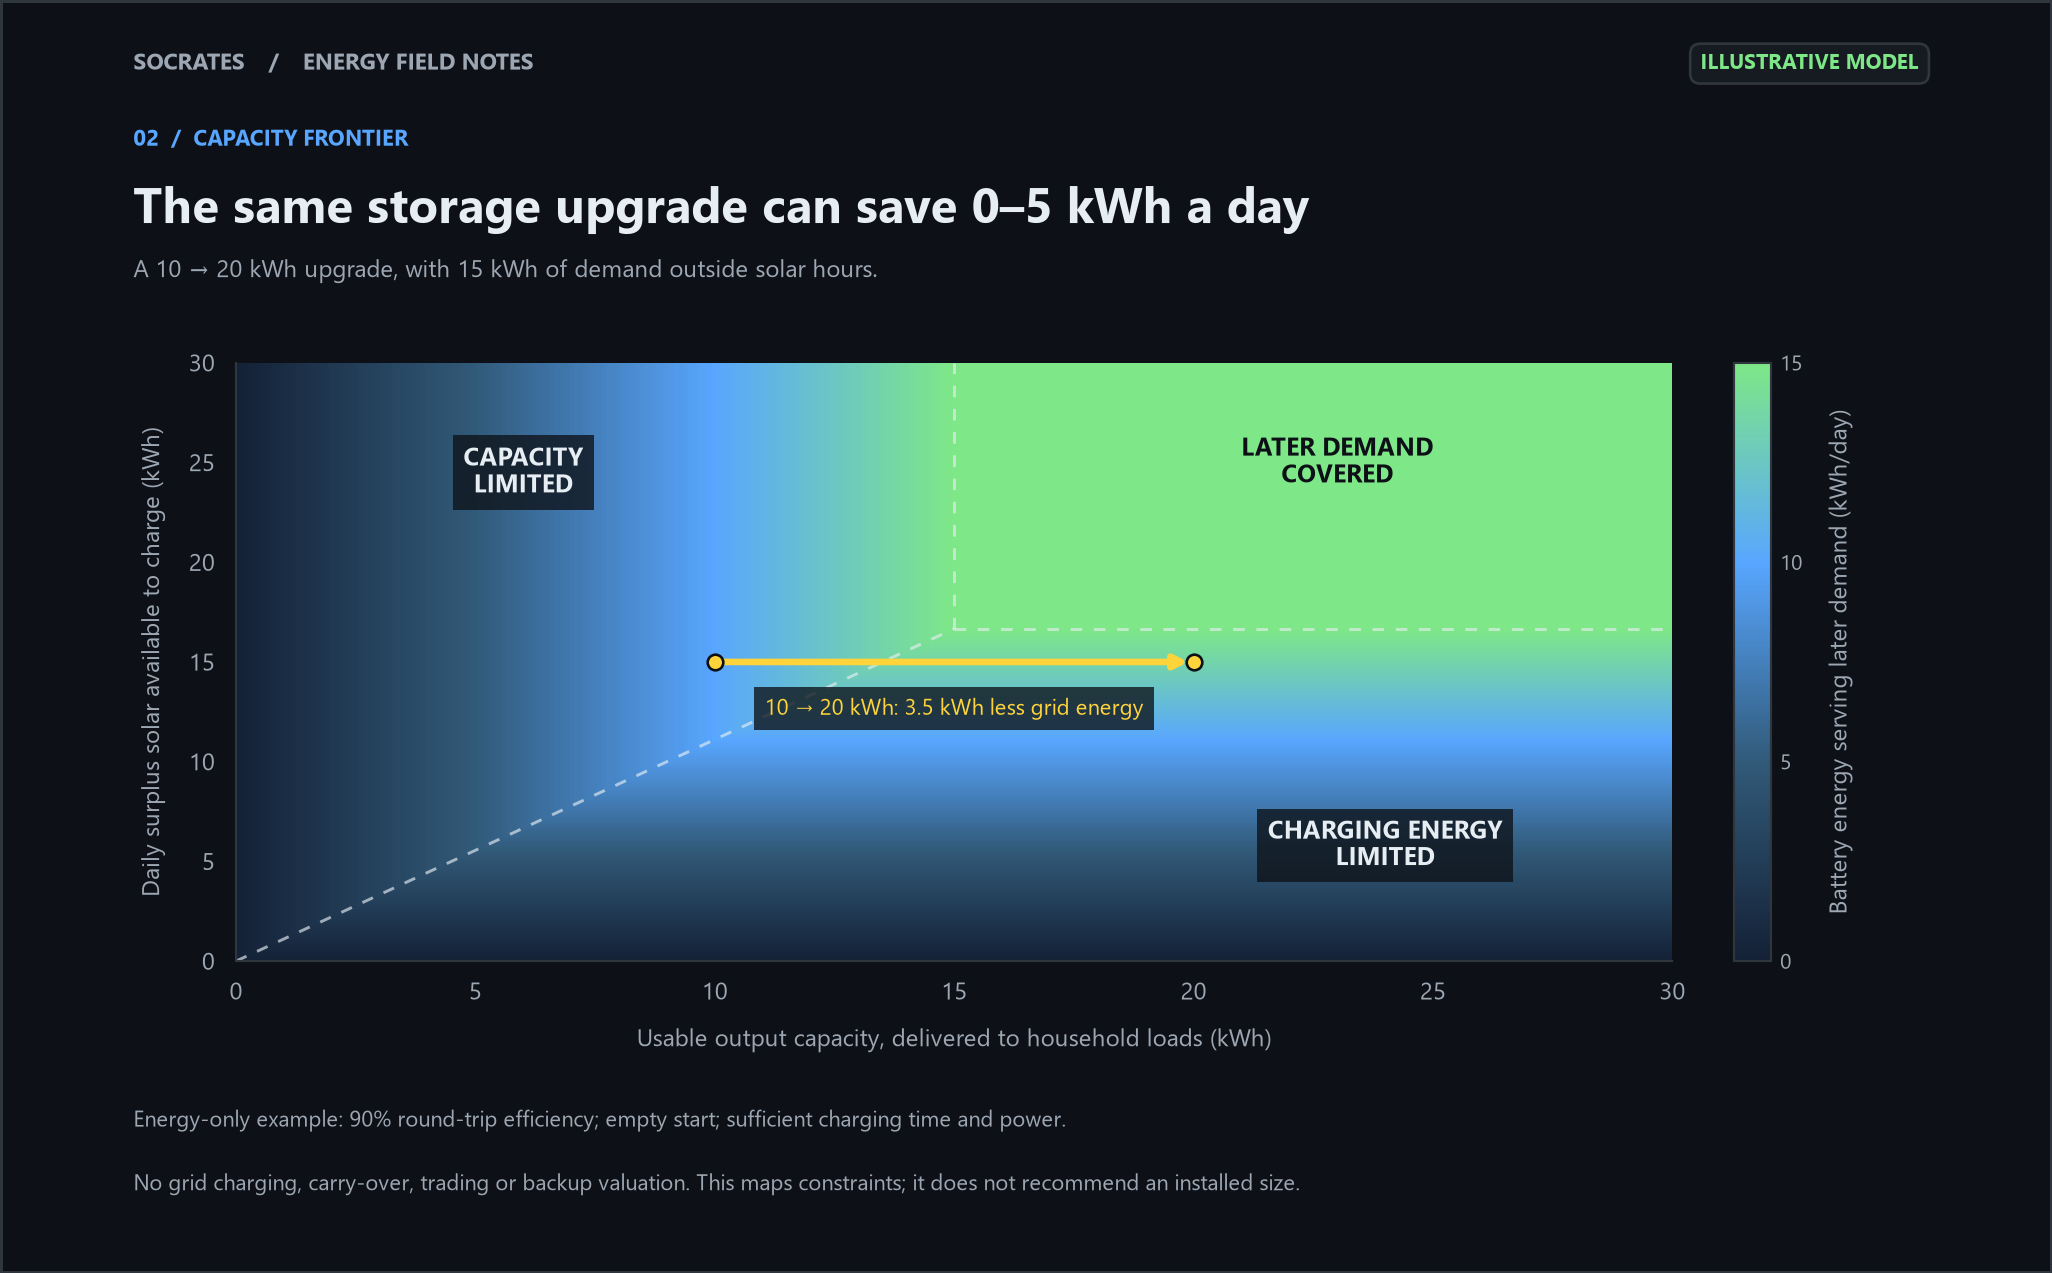
With 5 kWh of surplus solar, only 4.5 kWh returns to household loads. Increasing output capacity from 10 to 20 kWh changes nothing. With 15 kWh of surplus, the same upgrade supplies an extra 3.5 kWh later.
Even with abundant charging energy, the upgrade replaces at most another 5 kWh of purchases: the original capacity already covers 10 kWh of the 15 kWh requirement.
The frontier shows why capacity comparisons need an energy budget. Government battery guidance also considers consumption timing, solar size, usable capacity and future needs.
Grid charging, trading and backup give capacity other purposes. This model starts empty and excludes those uses, carry-over and power constraints; it does not recommend an installed size.
3. Do grid imports mean my battery is underperforming?
An import total cannot answer that on its own. Meaningful imports and exports often appeared within the same daily report.
Across our selected systems, 52% of observed system-days contained at least 5 kWh of grid imports and at least 5 kWh of exports. A system-day means one system's calendar-day report.
The curve tests larger flows in both directions: 65% of system-days reached 1 kWh each way; 39% reached 10 kWh.
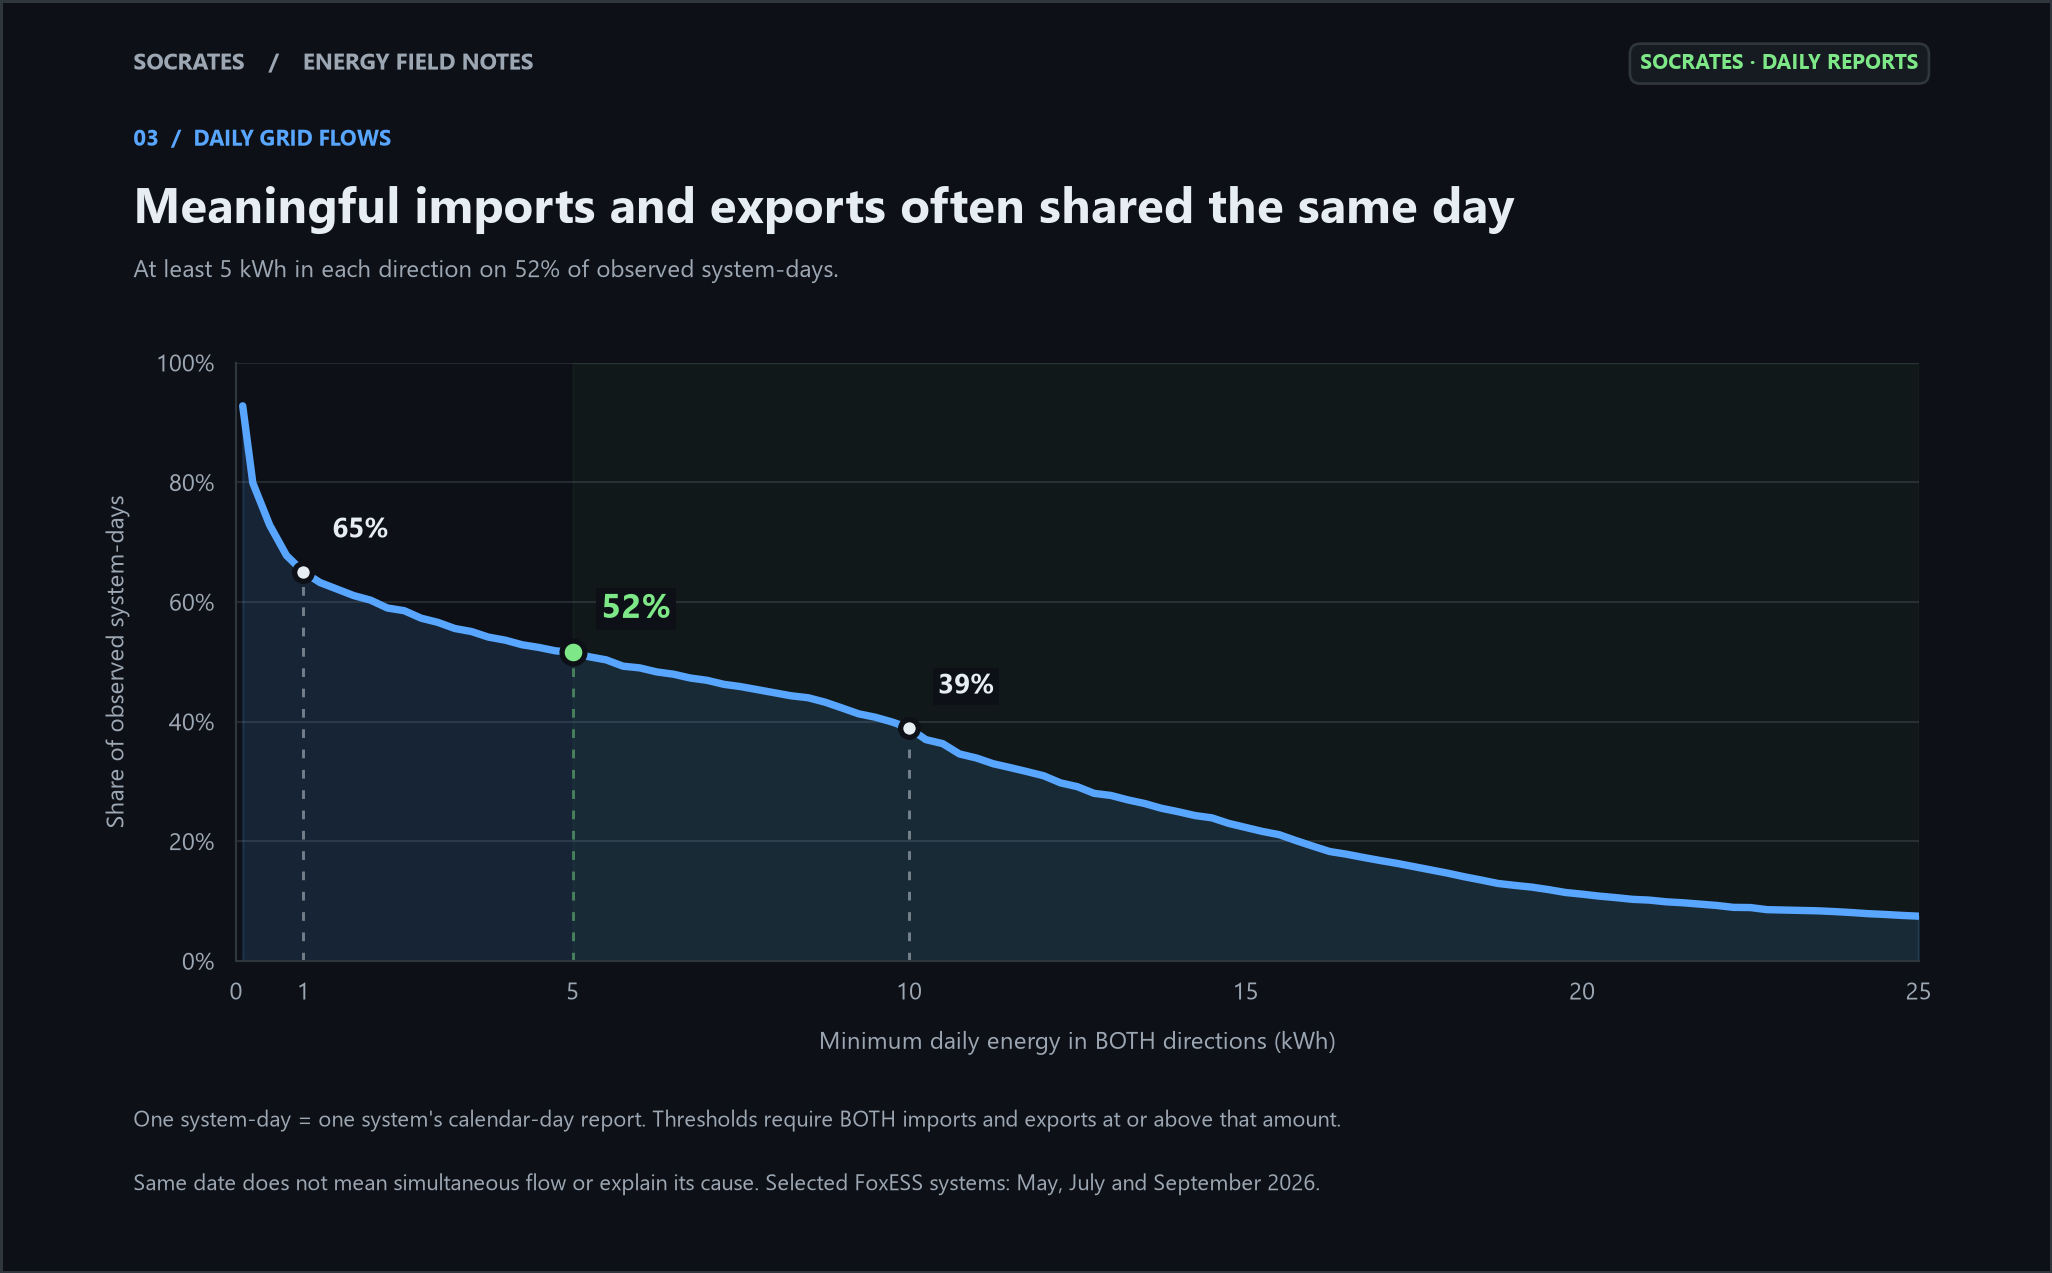
This establishes daily coexistence, not simultaneous flow or avoidable imports. A monthly net total can conceal substantial energy moving in both directions.
Possible explanations include demand above available solar and battery power, reserve settings, depleted storage and deliberate cheap charging. Tesla's reserve documentation, for example, explains how stored energy can be held for outages.
Our daily totals cannot identify which explanation applied. Diagnosis needs time-aligned imports, demand, battery charge and discharge, settings and tariffs. That context matters before treating every imported kWh as a missed opportunity.
4. How much does winter change the picture?
The median within-system July import increase was 76%, measured against each system's own September daily average.
We calculated average daily imports for each system in each observed month, compared them with its own September average, then took the median of those percentage changes. This follows the same systems rather than comparing two separate cohort medians.
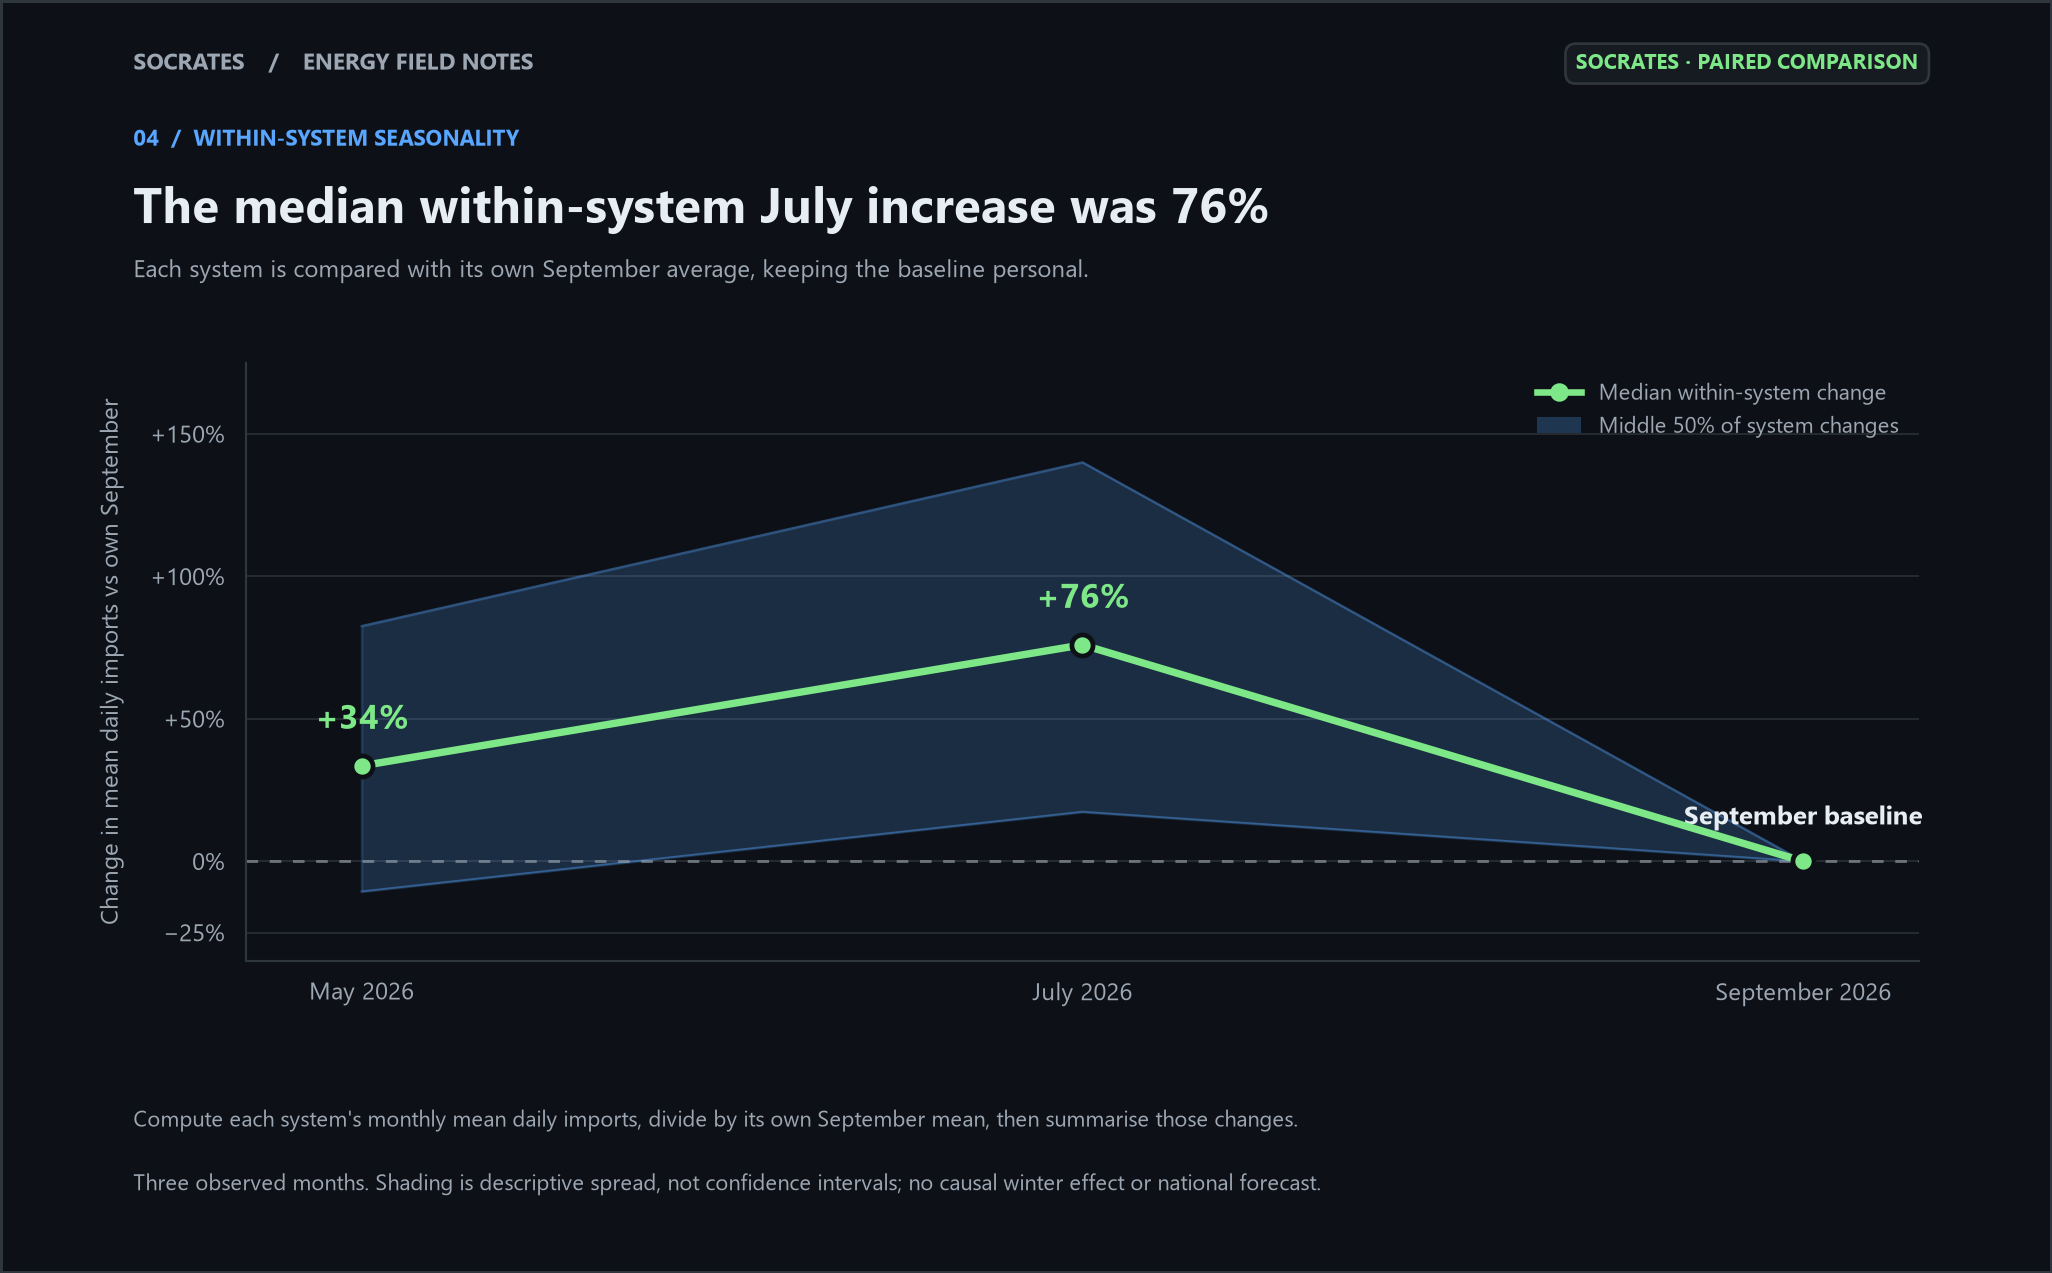
The middle half of July changes ranged from approximately 17% to 140% higher. Most systems imported more in July, but the median is not a forecast for every home.
These observations do not isolate weather, heating, household changes or charging strategy. They do show why comparing homes across different seasons can be misleading.
BOM's Ferny Creek statistics provide context: average June solar exposure is roughly one-quarter of January's. That is sunlight at one Victorian location, not rooftop output or a national ratio.
SoCrates' weekly Benchmarks page supports comparisons over time with recorded metrics, platform comparisons and confidence flags when eligible rollups are available.
5. Can your network tariff change which battery strategy pays?
A small tariff component can move a marginal trading cycle across zero on many days, even though its wholesale prices are unchanged.
We modelled the same cycle on 66 NSW weekdays in July–September 2026: buy 10 kWh uniformly during 11am–2pm, then export 9 kWh during 4–8pm. Both time windows use fixed AEST.
We applied the Endeavour FY2026–27 N71 solar-soak import component, 4.5355 c/kWh, and compared the result with and without the optional N61 low-season export reward of 3.4702 c/kWh. That reward adds approximately 31 cents to a 9 kWh export. All amounts exclude GST.
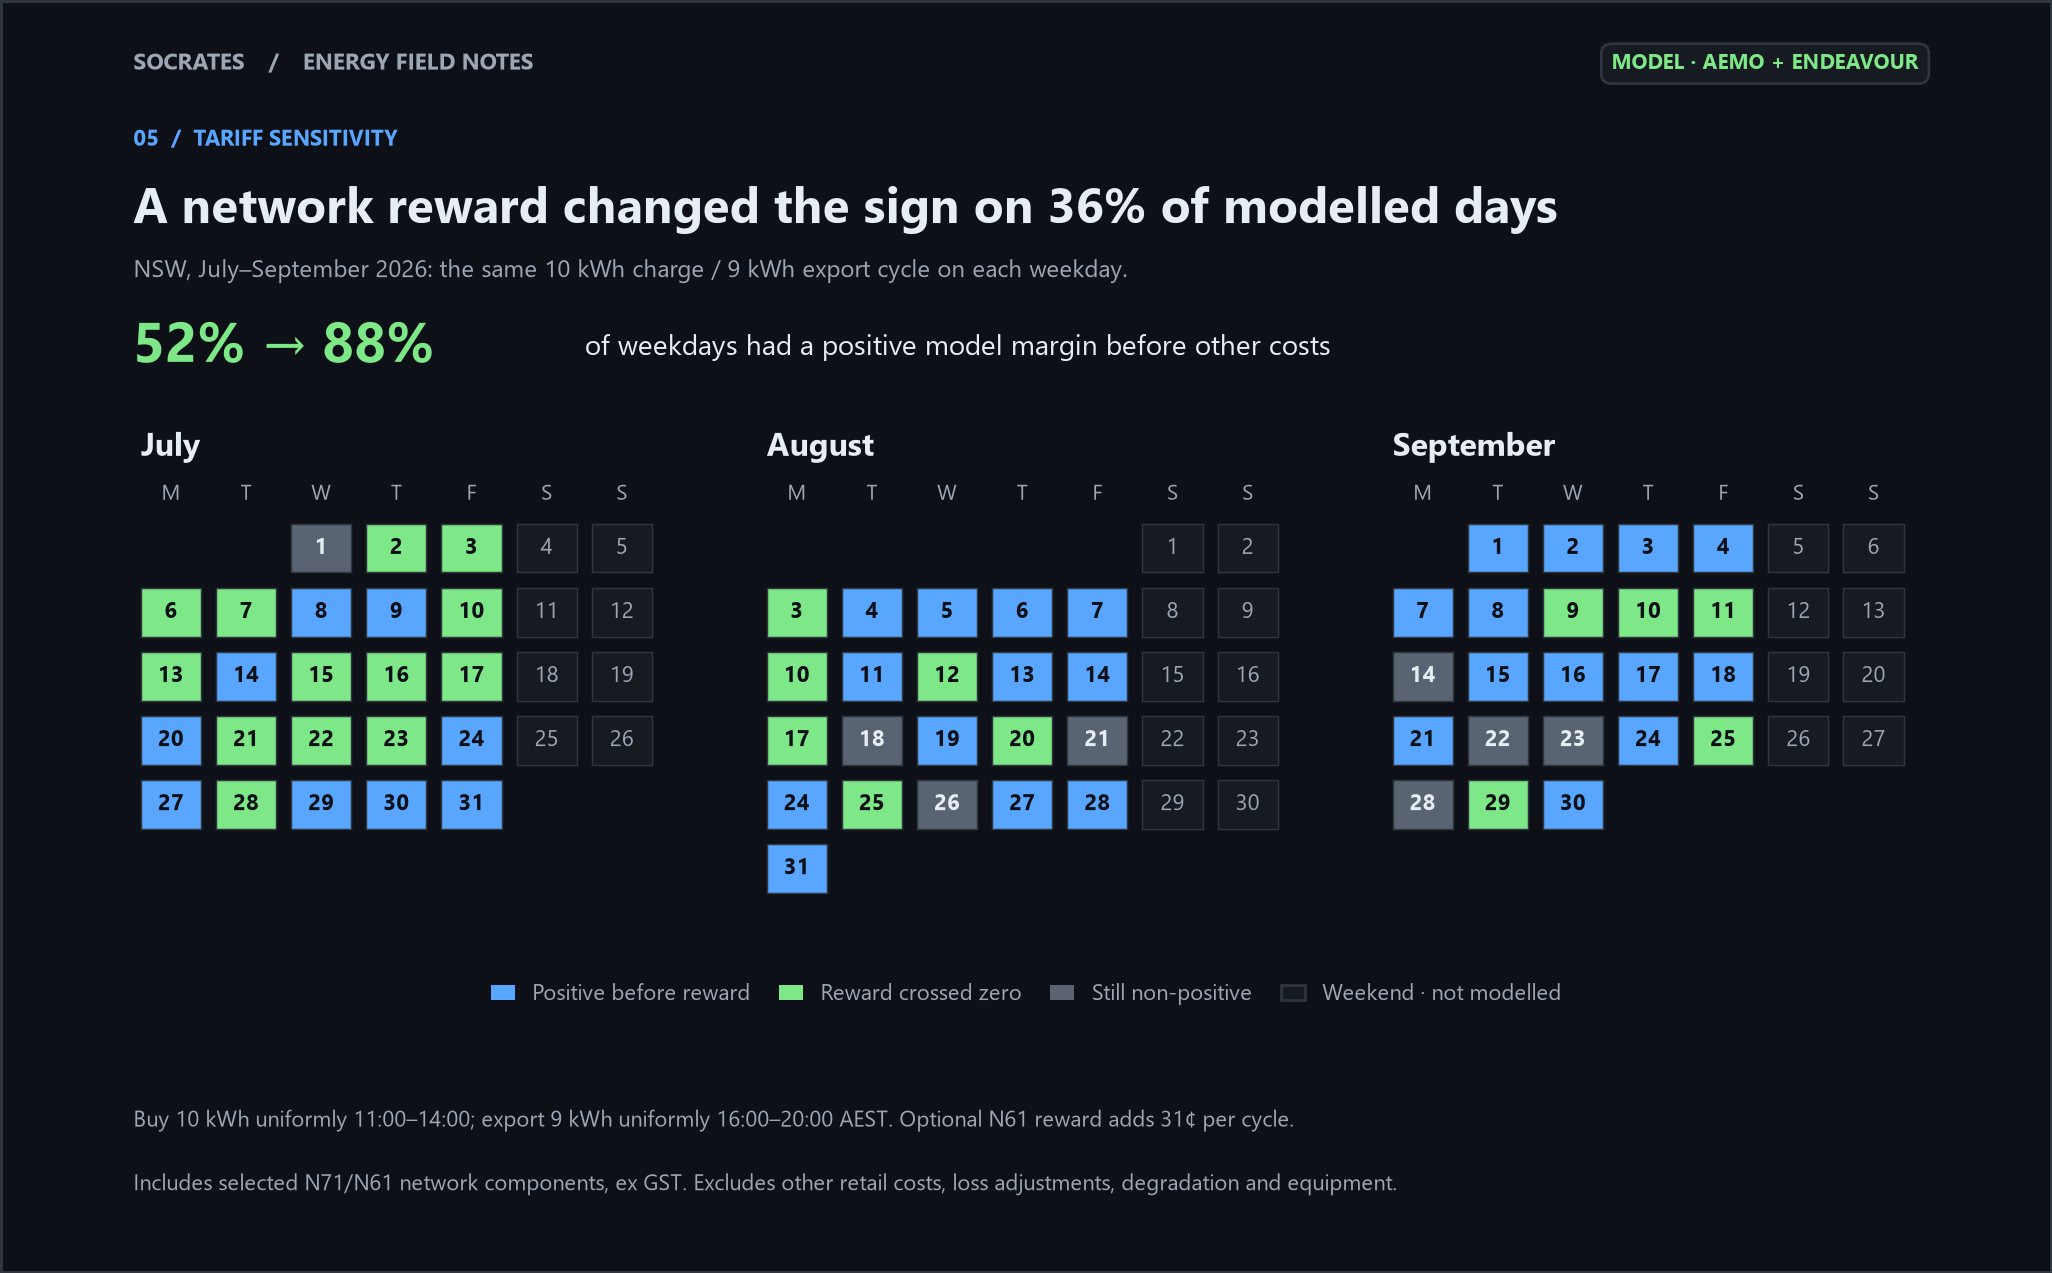
The model margin was positive on 34 of 66 weekdays without the reward, and 58 with it. The reward changed the sign on 24 days, or 36% of the modelled period.
Those are margins before other costs, not customer earnings. Other retail charges, distribution loss adjustments, degradation and equipment costs are excluded; the model also assumes sufficient capacity and power. There are no midday exports.
An export bonus can change the result while leaving a cycle vulnerable to other costs. Compare complete import and export terms before ranking plans by their largest advertised reward.
Together, these findings favour a more useful battery scorecard: current market conditions, energy available to charge, within-system seasonal changes, and the complete tariff. A single capacity figure, import total or high-price event leaves too much unexplained.
Explore your own context in SoCrates. Create an account and complete setup to explore heatmaps and day-level inspection in the full Market Insights workspace. With an eligible connected system and completed weekly rollups, Benchmarks (Beta) adds platform comparisons and confidence information. The public market preview is available without an account.